How to use this package#
Animation-maker can be use in a python script or in command line. Please check the Examples to see differents exemples of features.
Basic example#
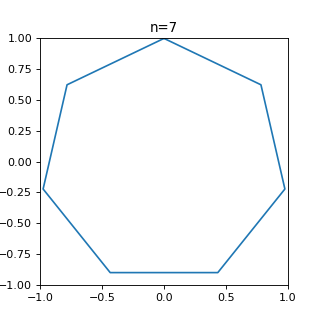
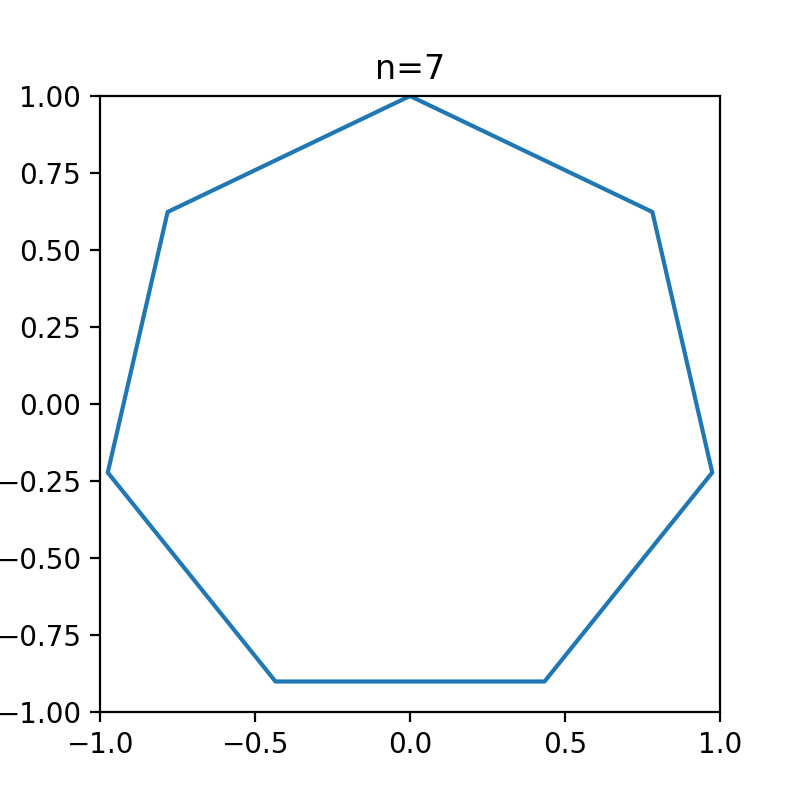
you want to create a small animation with matplotlib, to show how many points you need to draw a circle
import matplotlib.pyplot as plt
import numpy as np

fig, ax = plt.subplots(1, 1, figsize=(4,4), dpi=120,)

ax.set_xlim(-1,1); ax.set_ylim(-1,1)

n = 7
x = np.arange(n+1)/n * 2*np.pi
ax.plot(np.sin(x), np.cos(x))
ax.set_title("n=7")
(Source code, png, hires.png, pdf)

you need to define a plotting function with this patern :
import matplotlib.pyplot as plt
import numpy as np

def plot(i, ds):
    """
    Parameters
    ----------
    i: int
        indice of the image.
    ds: xarray.Dataset
        data passed to the plotting function


    Returns
    -------
    fig: matplotlib.figure.Figure
        the figure to save
    """


    fig, ax = plt.subplots(1, 1, figsize=(4,4), dpi=120,)

    ax.set_xlim(-1,1); ax.set_ylim(-1,1)

    n = i+7  # starts indices at 7
    x = np.arange(n+1)/n * 2*np.pi
    ax.plot(np.sin(x), np.cos(x))
    ax.set_title(f"n={i}")
    return fig
We will explain the ds argument later.
You should define all your plotting logic in this function, and return a matplotlib Figure.
You can use the i parameter to know which image is being computed.
now we have 2 choices to use the tool : the command line, or use in a python script.
Use in a python script or jupyter notebook#
import matplotlib.pyplot as plt
import numpy as np
import anim

def plot(i, ds):
    """
    Parameters
    ----------
    i: int
        indice of the image.
    ds: xarray.Dataset
        data passed to the plotting function


    Returns
    -------
    fig: matplotlib.figure.Figure
        the figure to save
    """

    fig, ax = plt.subplots(1, 1, figsize=(4,4), dpi=120,)
    ax.set_xlim(-1,1); ax.set_ylim(-1,1)

    n = i+7  # starts indices at 7
    x = np.arange(n+1)/n * 2*np.pi
    ax.plot(np.sin(x), np.cos(x))
    ax.set_title(f"n={i}")
    return fig

fps = 6
folder = "my_animation"
max_frames = fps * 7  # we want 7s of a video, with 6fps => 6*7=42 frames

anim.animate(plot, folder, fps, max_frames=max_frames)
Use in command line#
To use in a command line, you must define a script file with all function needed, then use the command anim:
create the circle.py file
 1import matplotlib.pyplot as plt
 2import numpy as np
 3
 4ANIM_FPS = 6
 5ANIM_OUTPUT_FOLDER = "my_animation"
 6ANIM_MAX_FRAMES = ANIM_FPS * 4
 7
 8def plot(i, ds):
 9    """
10    Parameters
11    ----------
12    i: int
13        indice of the image.
14    ds: xarray.Dataset
15        data passed to the plotting function
16
17
18    Returns
19    -------
20    fig: matplotlib.figure.Figure
21        the figure to save
22    """
23
24    fig, ax = plt.subplots(1, 1, figsize=(4, 4), dpi=120)
25    ax.set_xlim(-1, 1)
26    ax.set_ylim(-1, 1)
27
28    n = i + 7  # starts indices at 7
29    x = np.arange(n + 1) / n * 2 * np.pi
30    ax.plot(np.sin(x), np.cos(x))
31    ax.set_title(f"image {i} : n={n}")
32    return fig
then start
anim circle.py
you can check the result in the example Simple animation
Most practical way to use this tool#
When we are making an animation, most of the time we need a lot of trials / tests to adjust some little parameters, size, or fontsize for example.
Animation making can be long and computation expensive, and for this simple modification you don’t need to build all the animation to confirm you changes, usually only the first frames is enough.
Compute only the first image#
To only compute the first image of you animation, you can use the --show / -s parameter. It won’t use parallelization, just simply build the image and quit.
anim fancy_animation.py -s
It will open a matplotlib figure, as plt.show() would.
If you don’t want to have a popup with the figure, you can save it in a file. Just pass the name of the image to the show argument.
anim fancy_animation.py -s testing_image.png
Compute only specific images#
Sometimes the modification you did on your plotting function is only affecting certain images.
You can tell anim to show indices you want by specifying --only argument
# open a windows with the 64th image computed
anim fancy_animation.py --only 64 -s
This will only compute the 64th image of the animation.
Beware that all data are computed (if you specified a compute function for example), just not used for image creation.
# open a windows with the 2nd image, then 64, then 135, then 256
anim fancy_animation.py --only 2 64 135 256 -s
You can specify multiples images to be computed. The first one will be displayed, then the second one, etc..
If you still don’t want a display and prefer saving the file, you can combine the only argument and the show to save multiple pngs.
Just pass a name containing the template i, so anim will interpolate with the image indice.
# save the images `testing_005.png` and `testing_125.png`
anim fancy_animation.py --only 5 125 -s testing_{i:03d}.png
Features#
create a gif#
You can create a gif from your video, and specify the fps of the gif. The name of the gif will be the same as the video, with extension modified
# [...]
video_name = anim.animate(plot, folder, fps, max_frames=max_frames)
gif_name = anim.video2gif(video_name, gif_fps=5)  # <== specify fps of the giff
anim circle.py -g 5 # <== specify fps of the gif
Use a fonction to generate data on the fly#
Sometimes, you want to avoid build the data inside the plotting function. Because its too heavy, or maybe data are computed iterativelly.
we can define a function compute which should yield a xarray.Dataset containing all the data needed for the plot.
The easiest compute function example would be :
import xarray as xr

max_frames = 100

def compute():
    for _ in range(max_frames):
        yield xr.Dataset()
where the function yield an empty Dataset.
If you don’t specify a compute function that’s actually what anim does under the hood.
The xarray.Dataset that the compute fonction yield is actually passed in the plot function as the ds argument.
To see an example using the compute function, check the example Animation using computed data.
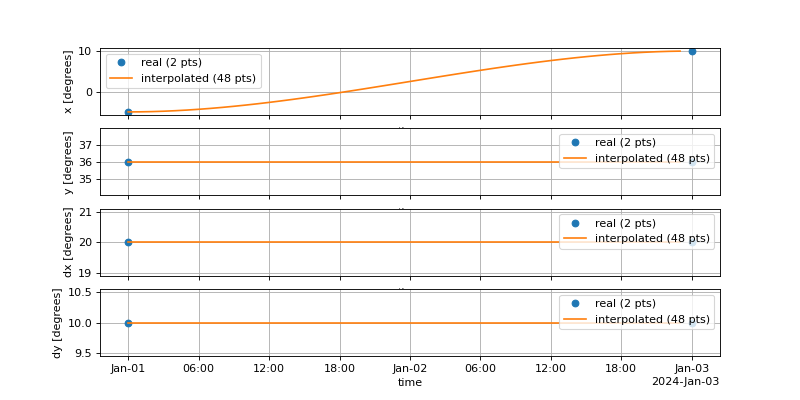
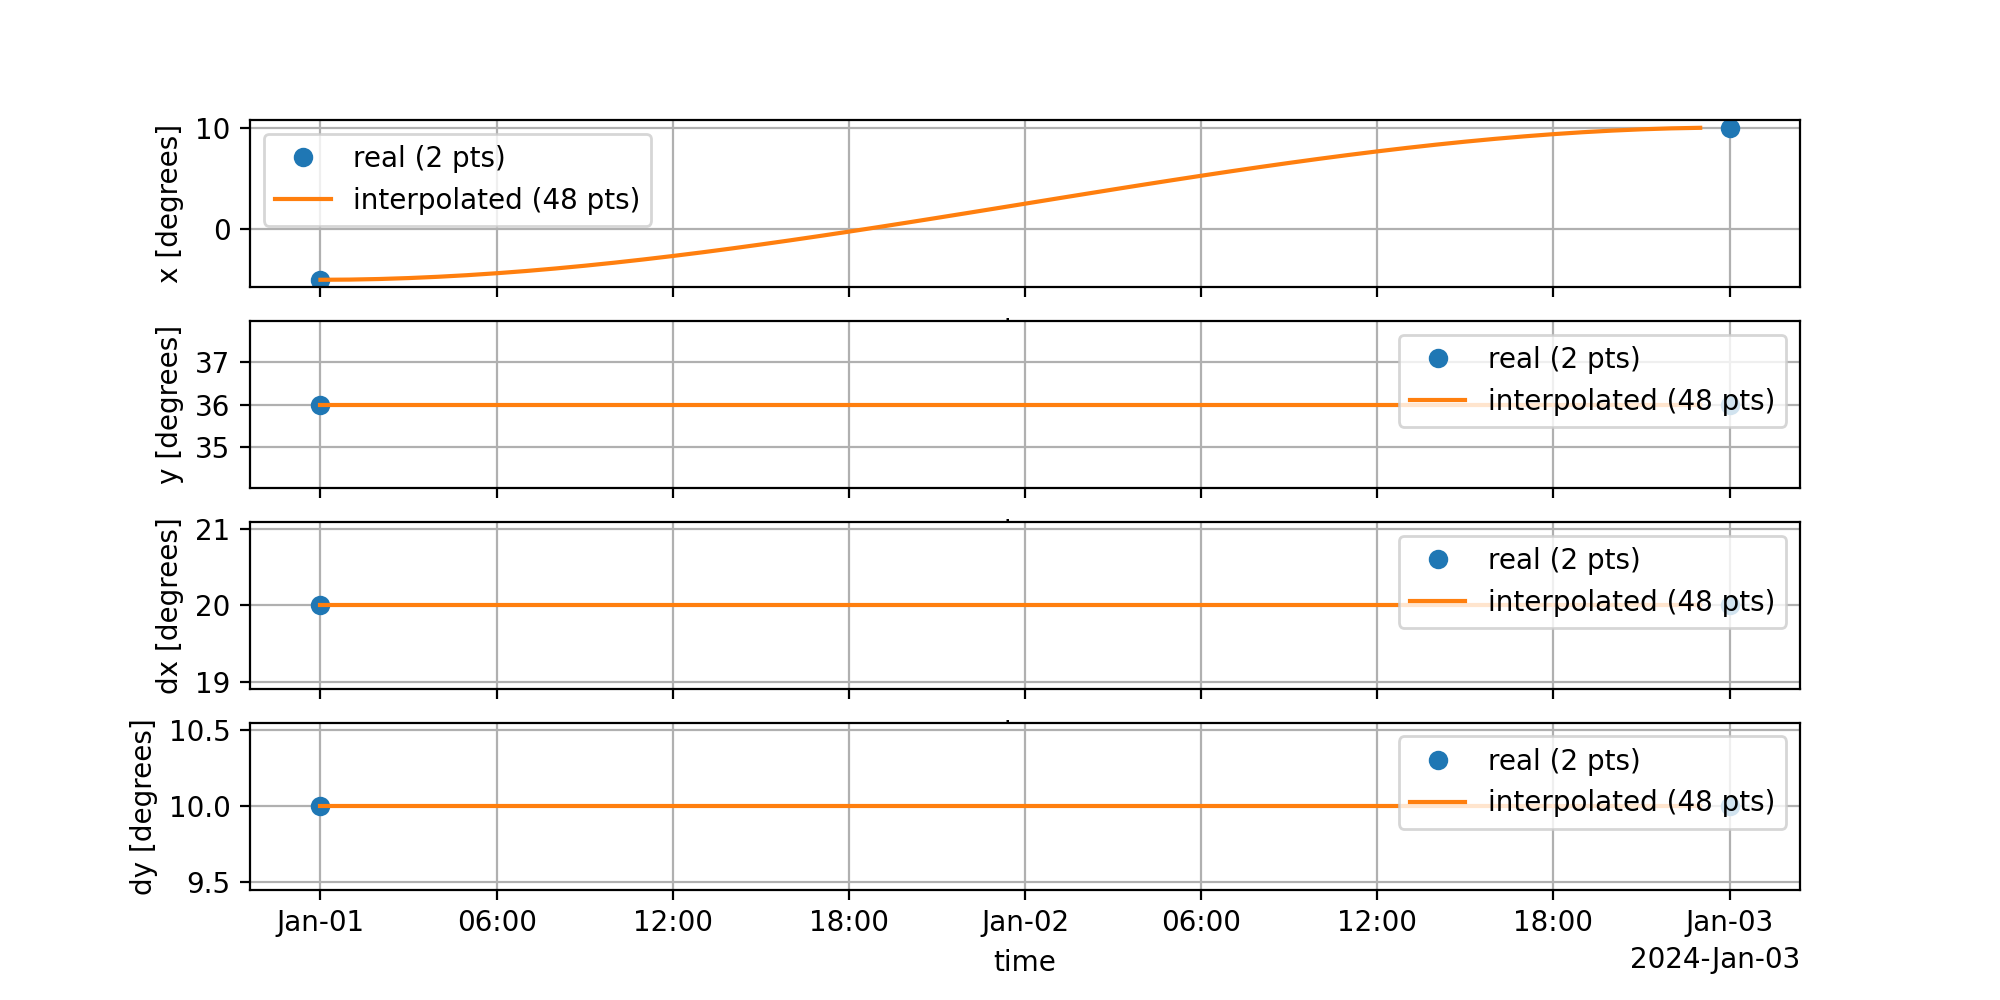
Move the camera easily#
Anim package provide a TimePath class which make it easy to create fancy animations where you can easily define a path for the camera.
Please check the Example Build a path for the camera to see how it works, and a nice example.
How to use it#
You design a path, which means a serie of points where your camera should go, and when the camera should be there.
For example, lets create a Path with 2 coordinates
import anim.path
import numpy as np


t0 = np.datetime64("2024-01-01")

path = anim.path.TimePath(coords=(-5, 36), dx=20, dy=10, t0=t0)
path.move(np.timedelta64(2, "D"), coords=(10, 36))

dates, extents, speed = path.compute_path(np.timedelta64(1, "h"))
With this code, the animation will start with the camera cented at -5, 36 with 40 (20*2) degree width and 20 (10*2) degrees height.
The dx and dy argument tells you how many degrees do you want each side of your points.
For example, a starting position of coords=(x0, y0), dx, dy would create a cartopy map with extent=[x0-dx, x0+dx, y0-dy, y0+dy]
Then, in 2 days, the camera should be at the position 10, 36.
the compute_path method will then compute each date, extent and speed value for each images.
The utility for the TimePath class is it will compute each points by using smooth interpolation, so the camera move smoothly with adjusted acceleration, then decelleration.
import anim.path
import numpy as np


t0 = np.datetime64("2024-01-01")

path = anim.path.TimePath(coords=(-5, 36), dx=20, dy=10, t0=t0)
path.move(np.timedelta64(2, "D"), coords=(10, 36))


# dates, extents, speed = path.compute_path(np.timedelta64(1, "h"))
fig, ax = path.plot_moves(np.timedelta64(1, "h"))
(Source code, png, hires.png, pdf)

You can see the acceleration then decelleration of x over time, while y, dx and dy did not move.
Please check the Example Build a path for the camera to see a complete live example.